Where in the World Do People Eat the Most Canned Fish?
A data-led map of prepared seafood markets — and an honest explanation of what trade statistics can and cannot prove.
AuthorDiplomats Editorial Team
ReviewerArtūrs BubišsChairman of the Board, SIA Unda
Published29 July 2026
Reading time16 min read
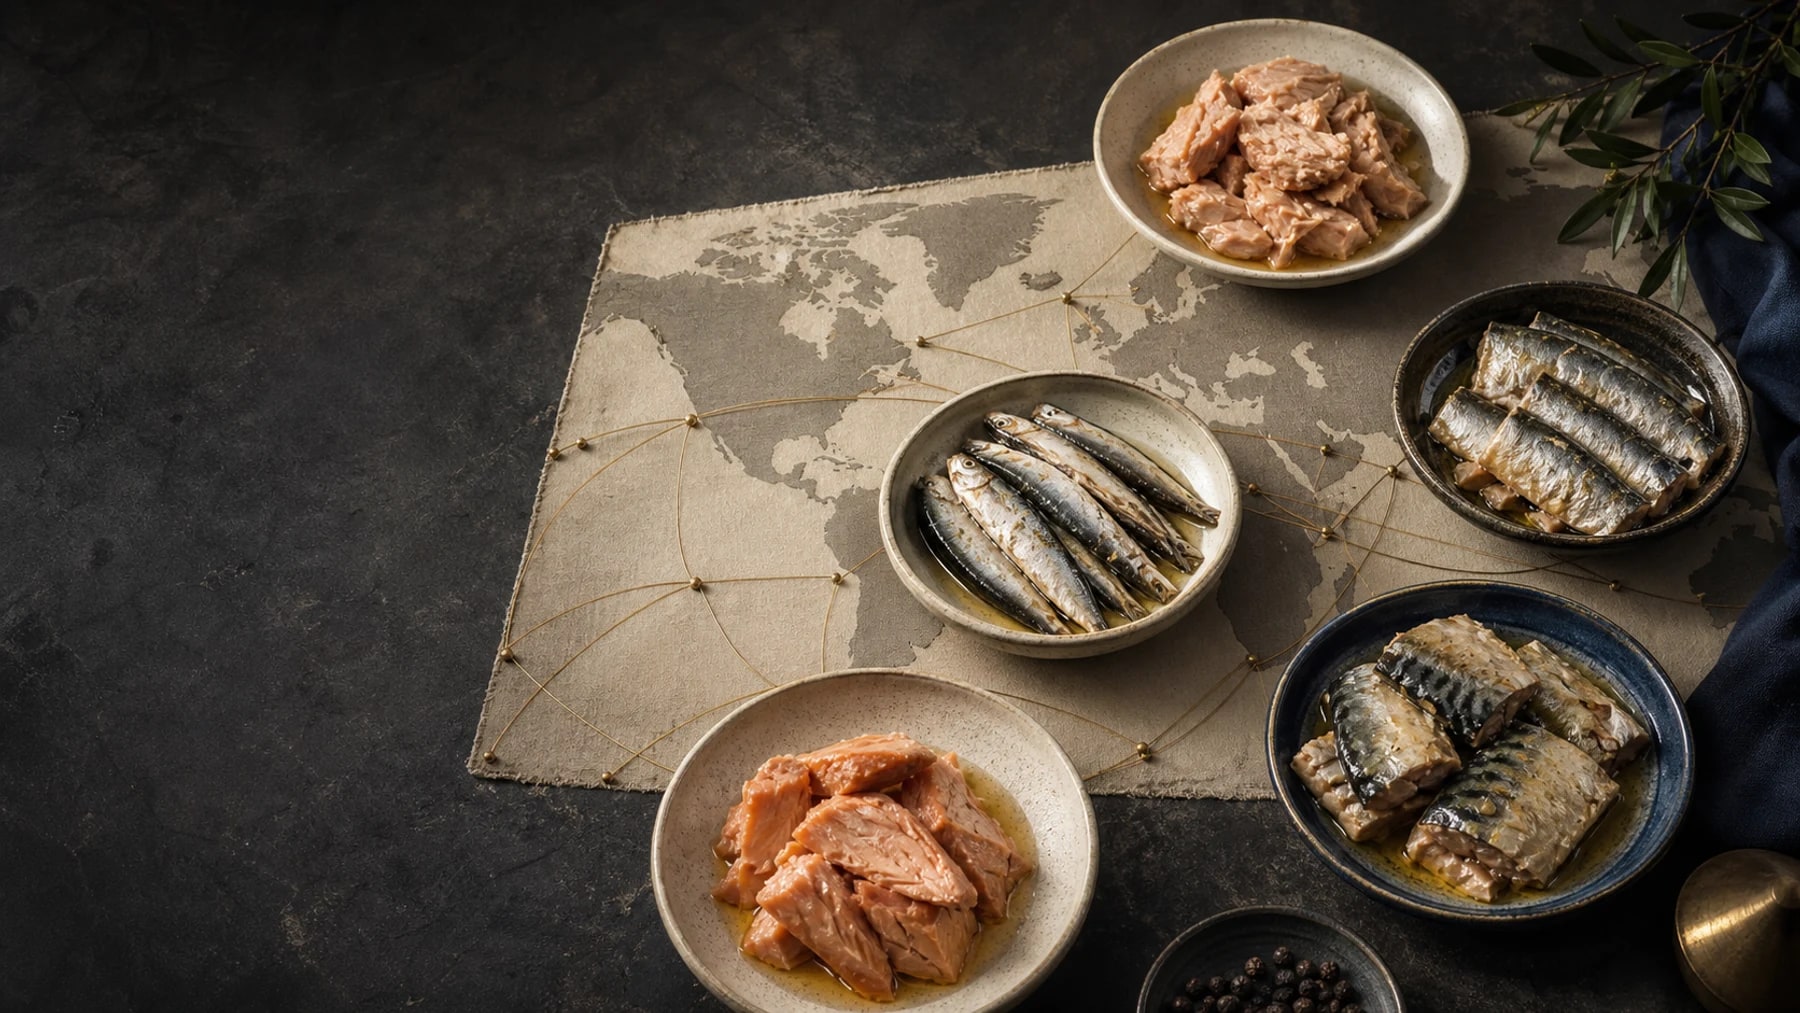
A visual interpretation of global prepared-seafood trade. It is not documentary evidence of a named market or supply chain.Editorial visualEditorial illustration. Not documentary photography or a depiction of one specific market.
Executive summary
Global trade data identify the largest destination markets and exporters for selected prepared and preserved fish categories. The figures are useful market indicators, not direct measurements of consumption. This article publishes the method, limitations and reproducible dataset alongside every chart.
The short answer
There is no single defensible league table of “canned fish consumption” covering every country. Public sources measure different things: household purchases, retail sales, apparent consumption, imports, exports or broader prepared-and-preserved fish categories.
The most transparent global comparison available for this article is trade. In 2023, the United States was the largest individual-country gross importer across six selected prepared and preserved fish headings, while Japan, Germany, Italy, Spain, France and the United Kingdom also formed major markets. That does not mean imports equal what residents ate.
Trade data can reveal the scale and direction of a market. It cannot, by itself, reveal the contents of a national plate.
What exactly did we measure?
We downloaded reporter trade with the World partner from UN Comtrade as distributed through World Bank WITS. The selected HS 1988/92 headings cover prepared or preserved salmon (160411), herring (160412), sardines, sardinella, brisling and sprats (160413), tuna, skipjack and bonito (160414), mackerel (160415), and other whole or pieced prepared fish (160419).
The dataset uses 2023 net quantities in kilograms and current US-dollar trade values. It excludes regional aggregates from the country ranking and uses World Bank population only for the explicitly labelled per-resident import proxy.
These headings are broader than metal cans. They can include jars, pouches and other prepared or preserved formats. Domestic production, re-exports, inventory changes, waste and informal trade are not resolved.
Where the largest import markets are
The combined ranking identifies large destination markets for selected prepared fish rather than a measure of taste or cultural importance. The United States leads by gross quantity, followed by Japan and several large European markets.
Market size reflects population, purchasing power, established retail categories, domestic supply and trading roles. A country may import heavily and re-export part of that volume; another may consume substantial domestic production without appearing high in an import ranking.
Gross import net quantity across six selected HS headings
Largest selected prepared and preserved fish import markets
1. United States: 317.2 million kg; 2. Japan: 222.1 million kg; 3. Germany: 203.2 million kg; 4. Italy: 174.0 million kg; 5. Spain: 165.1 million kg.
United States317.2m kg
USA
Japan222.1m kg
JPN
Germany203.2m kg
DEU
Italy174.0m kg
ITA
Spain165.1m kg
ESP
France159.9m kg
FRA
United Kingdom153.7m kg
GBR
Thailand71.5m kg
THA
Australia62.1m kg
AUS
Netherlands54.6m kg
NLD
Canada54.4m kg
CAN
Colombia49.8m kg
COL
1. United States: 317.2 million kg; 2. Japan: 222.1 million kg; 3. Germany: 203.2 million kg; 4. Italy: 174.0 million kg; 5. Spain: 165.1 million kg.
Item
Value
Context
United States
317.2m kg
USA
Japan
222.1m kg
JPN
Germany
203.2m kg
DEU
Italy
174.0m kg
ITA
Spain
165.1m kg
ESP
France
159.9m kg
FRA
United Kingdom
153.7m kg
GBR
Thailand
71.5m kg
THA
Australia
62.1m kg
AUS
Netherlands
54.6m kg
NLD
Canada
54.4m kg
CAN
Colombia
49.8m kg
COL
Year
2023
Unit
kilograms
Method
Annual reporter trade with World partner, HS 1988/92 (H0). Countries are ranked by reported net quantity. Regional aggregates are excluded.
Limitation
Prepared or preserved fish includes cans, jars, pouches and other formats. Gross trade is not the same as consumption or domestic production and may include re-exports.
Prepared or preserved tuna, skipjack and bonito is the largest and most internationally distributed of the selected headings. The United States, Spain, Italy, France, the United Kingdom, Germany and Japan are major import markets by reported net quantity.
On the export side, Thailand leads by a wide margin in 2023, followed by China, Spain, the Philippines, Indonesia and Vietnam. The ranking demonstrates an industrial and trading network, not the origin of every fish or the final ownership of every brand.
Gross import net quantity, HS 160414
Largest prepared or preserved tuna import markets
1. United States: 217.9 million kg; 2. Spain: 140.8 million kg; 3. Italy: 131.6 million kg; 4. France: 94.1 million kg; 5. United Kingdom: 88.1 million kg.
United States217.9m kg
USA
Spain140.8m kg
ESP
Italy131.6m kg
ITA
France94.1m kg
FRA
United Kingdom88.1m kg
GBR
Germany80.9m kg
DEU
Japan70.3m kg
JPN
Thailand56.2m kg
THA
Australia39.3m kg
AUS
Netherlands35.7m kg
NLD
1. United States: 217.9 million kg; 2. Spain: 140.8 million kg; 3. Italy: 131.6 million kg; 4. France: 94.1 million kg; 5. United Kingdom: 88.1 million kg.
Item
Value
Context
United States
217.9m kg
USA
Spain
140.8m kg
ESP
Italy
131.6m kg
ITA
France
94.1m kg
FRA
United Kingdom
88.1m kg
GBR
Germany
80.9m kg
DEU
Japan
70.3m kg
JPN
Thailand
56.2m kg
THA
Australia
39.3m kg
AUS
Netherlands
35.7m kg
NLD
Year
2023
Unit
kilograms
Method
Annual reporter trade with World partner, HS 1988/92 (H0). Countries are ranked by reported net quantity. Regional aggregates are excluded.
Limitation
Prepared or preserved fish includes cans, jars, pouches and other formats. Gross trade is not the same as consumption or domestic production and may include re-exports.
1. Thailand: 444.6 million kg; 2. China: 139.4 million kg; 3. Spain: 103.4 million kg; 4. Philippines: 80.7 million kg; 5. Indonesia: 69.6 million kg.
Thailand444.6m kg
THA
China139.4m kg
CHN
Spain103.4m kg
ESP
Philippines80.7m kg
PHL
Indonesia69.6m kg
IDN
Vietnam58.8m kg
VNM
Mauritius47.3m kg
MUS
Seychelles37.2m kg
SYC
Papua New Guinea35.7m kg
PNG
Italy30.8m kg
ITA
1. Thailand: 444.6 million kg; 2. China: 139.4 million kg; 3. Spain: 103.4 million kg; 4. Philippines: 80.7 million kg; 5. Indonesia: 69.6 million kg.
Item
Value
Context
Thailand
444.6m kg
THA
China
139.4m kg
CHN
Spain
103.4m kg
ESP
Philippines
80.7m kg
PHL
Indonesia
69.6m kg
IDN
Vietnam
58.8m kg
VNM
Mauritius
47.3m kg
MUS
Seychelles
37.2m kg
SYC
Papua New Guinea
35.7m kg
PNG
Italy
30.8m kg
ITA
Year
2023
Unit
kilograms
Method
Annual reporter trade with World partner, HS 1988/92 (H0). Countries are ranked by reported net quantity. Regional aggregates are excluded.
Limitation
Prepared or preserved fish includes cans, jars, pouches and other formats. Gross trade is not the same as consumption or domestic production and may include re-exports.
HS 160413 brings several commercial and biological groups together: sardines, sardinella, brisling and sprats. Morocco and China are the largest reported exporters in the 2023 data, followed by Thailand. Latvia appears among the ten largest country exporters by net quantity.
That combined heading is useful for trade comparison but cannot tell us how much of a country’s total is Sardina pilchardus, Sprattus sprattus or another species. Product-level naming and destination-market labelling still matter.
Gross export net quantity, HS 160413
Largest sardine, sardinella, brisling and sprat exporters
1. Morocco: 119.4 million kg; 2. China: 99.7 million kg; 3. Thailand: 56.1 million kg; 4. Indonesia: 17.4 million kg; 5. Latvia: 16.4 million kg.
Morocco119.4m kg
MAR
China99.7m kg
CHN
Thailand56.1m kg
THA
Indonesia17.4m kg
IDN
Latvia16.4m kg
LVA
Portugal10.7m kg
PRT
Poland8.8m kg
POL
Canada8.7m kg
CAN
Philippines7.4m kg
PHL
Vietnam7.3m kg
VNM
1. Morocco: 119.4 million kg; 2. China: 99.7 million kg; 3. Thailand: 56.1 million kg; 4. Indonesia: 17.4 million kg; 5. Latvia: 16.4 million kg.
Item
Value
Context
Morocco
119.4m kg
MAR
China
99.7m kg
CHN
Thailand
56.1m kg
THA
Indonesia
17.4m kg
IDN
Latvia
16.4m kg
LVA
Portugal
10.7m kg
PRT
Poland
8.8m kg
POL
Canada
8.7m kg
CAN
Philippines
7.4m kg
PHL
Vietnam
7.3m kg
VNM
Year
2023
Unit
kilograms
Method
Annual reporter trade with World partner, HS 1988/92 (H0). Countries are ranked by reported net quantity. Regional aggregates are excluded.
Limitation
Prepared or preserved fish includes cans, jars, pouches and other formats. Gross trade is not the same as consumption or domestic production and may include re-exports.
Dividing gross imports by population can make smaller, highly engaged markets visible. Portugal, Spain, Italy, Estonia, France, the United Kingdom and Latvia rank strongly in this selected indicator.
This is not per-capita consumption. Imports can be processed, stored, wasted or re-exported, while domestic production is absent from the numerator. It is best read as an indicator of import availability and market intensity.
Gross imports across six selected HS headings divided by population
Selected prepared and preserved fish imports per resident
1. Romania: 18464284.00 kg per resident; 2. Serbia, FR(Serbia/Montenegro): 9898487.00 kg per resident; 3. Congo, Dem. Rep.: 5793985.00 kg per resident; 4. East Timor: 1338761.00 kg per resident; 5. Montenegro: 1108518.00 kg per resident.
Romania18464284.00 kg
Gross import proxy per resident
Serbia, FR(Serbia/Montenegro)9898487.00 kg
Gross import proxy per resident
Congo, Dem. Rep.5793985.00 kg
Gross import proxy per resident
East Timor1338761.00 kg
Gross import proxy per resident
Montenegro1108518.00 kg
Gross import proxy per resident
Montserrat9725.00 kg
Gross import proxy per resident
Samoa19.80 kg
Gross import proxy per resident
Barbados11.58 kg
Gross import proxy per resident
Fiji7.24 kg
Gross import proxy per resident
Malta6.71 kg
Gross import proxy per resident
Gabon5.04 kg
Gross import proxy per resident
Jamaica4.52 kg
Gross import proxy per resident
Grenada4.47 kg
Gross import proxy per resident
French Polynesia4.16 kg
Gross import proxy per resident
Portugal3.98 kg
Gross import proxy per resident
1. Romania: 18464284.00 kg per resident; 2. Serbia, FR(Serbia/Montenegro): 9898487.00 kg per resident; 3. Congo, Dem. Rep.: 5793985.00 kg per resident; 4. East Timor: 1338761.00 kg per resident; 5. Montenegro: 1108518.00 kg per resident.
Item
Value
Context
Romania
18464284.00 kg
Gross import proxy per resident
Serbia, FR(Serbia/Montenegro)
9898487.00 kg
Gross import proxy per resident
Congo, Dem. Rep.
5793985.00 kg
Gross import proxy per resident
East Timor
1338761.00 kg
Gross import proxy per resident
Montenegro
1108518.00 kg
Gross import proxy per resident
Montserrat
9725.00 kg
Gross import proxy per resident
Samoa
19.80 kg
Gross import proxy per resident
Barbados
11.58 kg
Gross import proxy per resident
Fiji
7.24 kg
Gross import proxy per resident
Malta
6.71 kg
Gross import proxy per resident
Gabon
5.04 kg
Gross import proxy per resident
Jamaica
4.52 kg
Gross import proxy per resident
Grenada
4.47 kg
Gross import proxy per resident
French Polynesia
4.16 kg
Gross import proxy per resident
Portugal
3.98 kg
Gross import proxy per resident
Year
2023
Unit
kilograms per resident
Method
Annual reporter trade with World partner, HS 1988/92 (H0). Countries are ranked by reported net quantity. Regional aggregates are excluded.
Limitation
Gross imports divided by population are a trade-availability proxy, not consumption. Re-exports, stocks, domestic production and waste are not resolved.
Tuna supplies mass-market convenience and globally standardised formats. Sardines and sprats combine everyday value with regional traditions and premium conservas. Salmon occupies both mainstream and premium positions. Herring remains important in northern and eastern European food cultures. Mackerel offers an oily-fish alternative, while the residual “other fish” heading gathers many products that should not be treated as one species story.
The composition of a national market therefore matters as much as the total. Two countries with similar volumes may be buying very different products.
Sum of reported gross import net quantities by selected HS heading
Selected prepared and preserved fish imports by species group
1. Tuna: 1436.6 million kg; 2. Other fish: 530.3 million kg; 3. Sardines and sprats: 368.1 million kg; 4. Mackerel: 167.0 million kg; 5. Herring: 136.7 million kg.
Tuna1436.6m kg
160414
Other fish530.3m kg
160419
Sardines and sprats368.1m kg
160413
Mackerel167.0m kg
160415
Herring136.7m kg
160412
Salmon83.9m kg
160411
1. Tuna: 1436.6 million kg; 2. Other fish: 530.3 million kg; 3. Sardines and sprats: 368.1 million kg; 4. Mackerel: 167.0 million kg; 5. Herring: 136.7 million kg.
Item
Value
Context
Tuna
1436.6m kg
160414
Other fish
530.3m kg
160419
Sardines and sprats
368.1m kg
160413
Mackerel
167.0m kg
160415
Herring
136.7m kg
160412
Salmon
83.9m kg
160411
Year
2023
Unit
kilograms
Method
Annual reporter trade with World partner, HS 1988/92 (H0). Countries are ranked by reported net quantity. Regional aggregates are excluded.
Limitation
Prepared or preserved fish includes cans, jars, pouches and other formats. Gross trade is not the same as consumption or domestic production and may include re-exports.
Prepared seafood connects vessels, aquaculture, ports, processors, packaging suppliers, laboratories, logistics and retailers. Its economic value is not confined to the fish inside a container.
EUMOFA reports that Latvia’s fish-processing sector employed 2,568 people in 2023 and generated EUR 62 million in value added. Portugal’s sector employed 9,580 and generated EUR 306 million in value added. These national profiles use a broader fish-processing scope than the six trade headings, so they are context rather than a direct extension of the chart.
People employed in the national fish-processing sector
Fish-processing employment in two coastal-economy examples
EUMOFA reports 9,580 people employed in Portugal’s fish-processing sector and 2,568 in Latvia in 2023.
Portugal9,580 people
EUMOFA country profile
Latvia2,568 people
EUMOFA country profile
EUMOFA reports 9,580 people employed in Portugal’s fish-processing sector and 2,568 in Latvia in 2023.
Item
Value
Context
Portugal
9,580 people
EUMOFA country profile
Latvia
2,568 people
EUMOFA country profile
Year
2023
Unit
people
Method
Country-profile employment figures reported by EUMOFA for the national fish-processing sector.
Limitation
These are contextual national processing-sector figures, not employment attributable to canned fish or to the six selected HS headings. Two examples do not form a global ranking.
Thailand’s tuna exports show the scale possible when processing capacity, sourcing networks and export logistics converge. Spain combines a large domestic market with significant exports. Morocco is a major sardine exporter, while Latvia has a specialised position in sardines, brisling and sprats.
These examples should not be reduced to a single factory model. Species, labour, vessel structure, certification, packaging and destination-market requirements differ materially.
Brands make a global category legible
Major companies have helped standardise expectations around format, convenience and availability. Rio Mare and its Bolton heritage, Thai Union’s international portfolio, Dongwon in Korea and Century Pacific in the Philippines illustrate different paths from regional strength to large-scale seafood brands.
Company-reported scale or market position is not independent market research. Brand sources are used here only for corporate history and portfolio context, not to manufacture a global market-share ranking.
A map of flows, not a map of appetite
The strongest importing markets cluster in North America, Europe and Japan, while major exporters span Southeast Asia, East Asia, southern Europe, North Africa and the Indian Ocean. The network reflects fishing grounds, processing centres, trade agreements, logistics and demand.
A route on a trade map should never be mistaken for biological origin or proof that a product was caught, processed and consumed in the same country.
Global prepared-seafood network
Production centres and destination markets
Supply
Fishing and aquaculture regions
Biological origin begins with a species and a documented supply area.
Processing
Specialised processing countries
Thailand, China, Spain, Morocco, Latvia and others add value in different species categories.
Trade
International logistics
Reported exports and imports trace commercial movement, which can include re-exports.
Demand
Large destination markets
North America, Europe and Japan account for many of the largest reported import volumes.
A conceptual flow, not a claim that every product follows the same route.Editorial synthesis of the 2023 WITS / UN Comtrade dataset published with this article.
What the numbers cannot tell us
The data do not identify retail channel, package material, drained weight, household waste, restaurant use or who ultimately consumed a product. Quantity and value can also be revised by reporting authorities.
For rigorous comparison, every chart on this page carries its own metric, year, unit, source, method and limitation. The downloadable file preserves the rows used, so an independent reader can reproduce or challenge the ranking.
The honest conclusion
People eat prepared seafood around the world, but the category is not one uniform habit. Large import markets, specialised production countries and strong per-resident trade indicators each answer a different question.
The most useful conclusion is not a winner. It is a clearer map of how tuna, sardines, sprats, salmon, herring and mackerel move through the world — and an equally clear account of what those movements do not prove.
Open data
Download the global prepared seafood trade dataset
The country, indicator, HS code, year, volume, value, population, per-capita proxy, method, source URL and limitation used in this article.
This article may be republished in full or in part without prior permission, provided Diplomats / SIA Unda is clearly credited as the original publisher and a visible, clickable direct link points to the original article on diplomats.fish.
Original charts and editorial graphics created for this article may be republished with the same attribution and direct source link. Third-party images, data and quoted material remain subject to the rights and terms of their original publishers.
Retain the original title.
Credit Diplomats / SIA Unda as the original publisher.
Retain the original publication date.
Include a visible, clickable direct link to the canonical article on diplomats.fish.
Keep sources, methodology notes, limitations and editorial disclaimers with the republished text.
Do not materially alter the evidence or imply endorsement.
Provide canonical attribution where the publishing platform supports it.